Home Lab
Observability
Deeper operational insight through centralized metrics, logs, dashboards, telemetry, historical analysis, and correlation across infrastructure and applications.
Observability Strategy+
Observability is intended to answer questions that basic health monitoring cannot answer on its own.
Monitoring can identify that a service is slow, unavailable, or consuming unusual resources. Observability helps investigate why that behavior is occurring and what other systems changed at the same time.
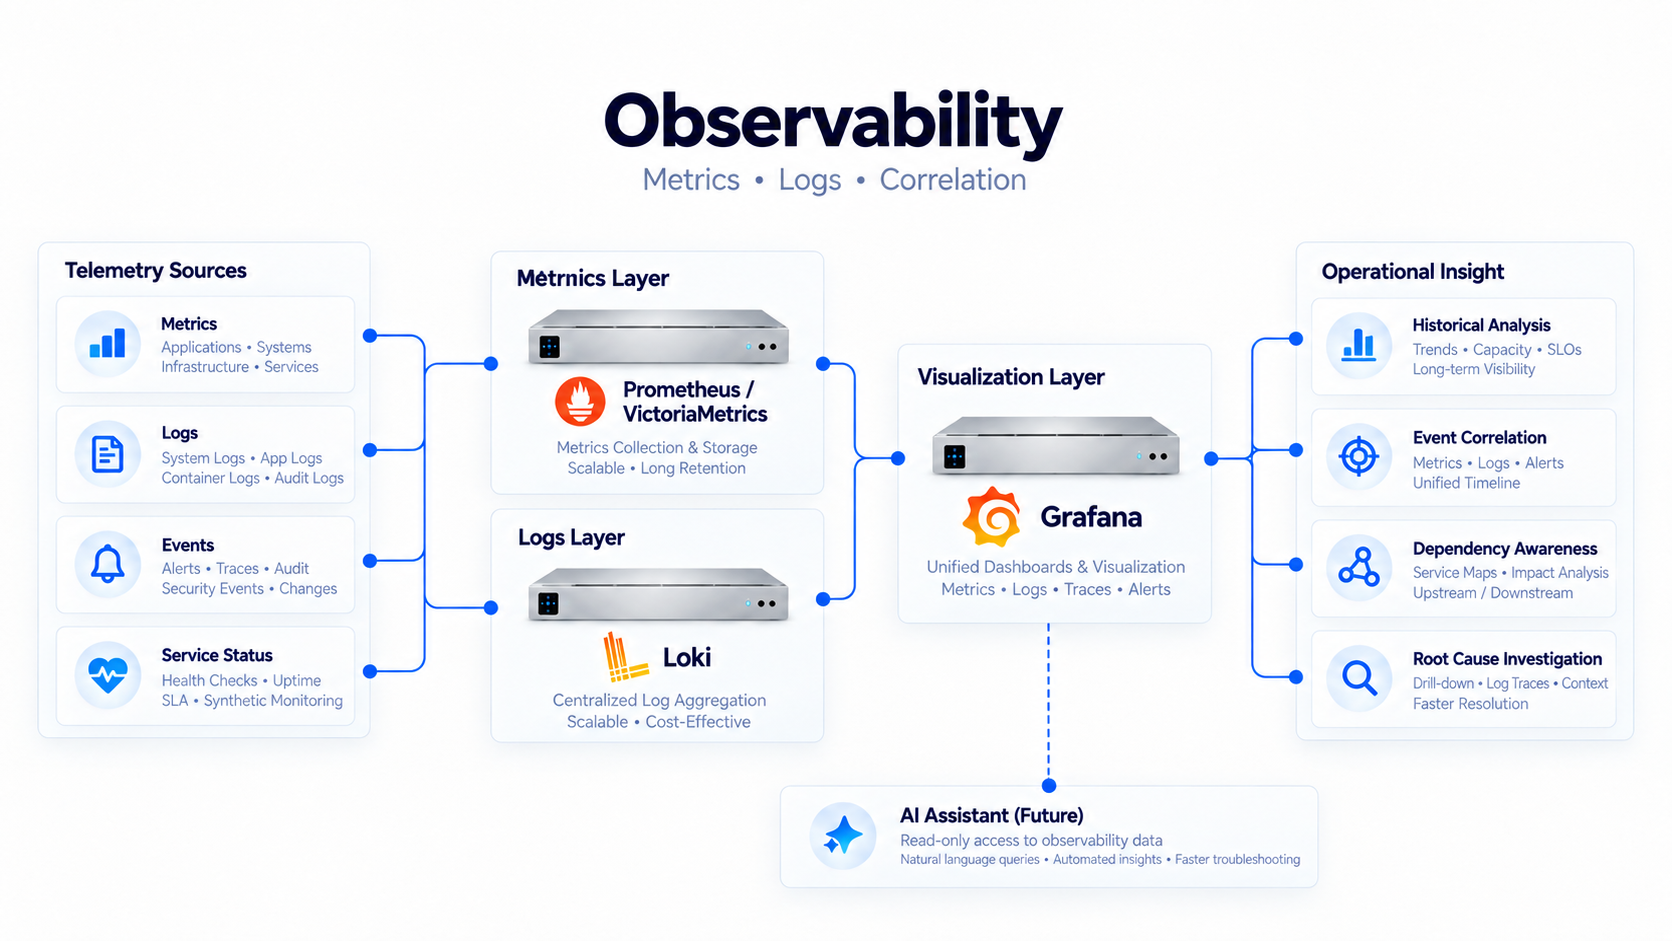
The environment therefore combines metrics, logs, dashboards, historical telemetry, and infrastructure context so troubleshooting can move beyond checking individual systems one at a time.
Metrics+
Prometheus and VictoriaMetrics provide the metrics foundation for the environment.
Metrics make infrastructure behavior measurable over time and allow current conditions to be compared with prior baselines.
CPU, memory, storage, network, service, and device metrics can reveal saturation, gradual degradation, recurring patterns, and abnormal behavior that may not be obvious from an isolated point-in-time inspection.
Centralized Logging with Loki+
Loki provides centralized log aggregation for supported workloads.
Centralized logs reduce the need to sign into multiple servers and manually inspect individual log files when troubleshooting a problem that crosses service boundaries.
Logs provide the event-level detail that metrics often cannot, including application errors, authentication events, service restarts, failed connections, and other operational messages.
The value increases when logs can be viewed in the same operational context as metrics and dashboards.
Grafana Dashboards+
Grafana acts as the primary visualization layer for observability data.
Dashboards can combine metrics from multiple infrastructure layers so related systems can be examined together rather than as isolated components.
A troubleshooting view can therefore include application health, compute utilization, storage behavior, and network-related measurements in one place.
The objective is not to create dashboards for appearance alone. Each dashboard should help answer a specific operational question.
Historical Analysis+
Historical telemetry makes it possible to determine whether an event is new, recurring, gradually worsening, or part of a normal pattern.
This is particularly useful for storage growth, memory pressure, CPU saturation, network utilization, and intermittent service behavior.
Instead of relying on memory or screenshots, historical data provides evidence that can be compared across days, weeks, or longer periods.
Event Correlation+
Many infrastructure failures are not isolated to one component.
An application may become slow because of a saturated filesystem, a DNS issue, a failed mount, a network path problem, database latency, or pressure on the compute host.
Observability is intended to make those relationships easier to see by correlating timestamps, metrics, logs, availability changes, and infrastructure events.
The goal is to reduce mean time to identify the actual failure domain rather than repeatedly troubleshooting the application that happens to show the first visible symptom.
Service Dependency Awareness+
The lab contains many layered dependencies: applications rely on virtual machines or containers, which rely on compute hosts, networking, DNS, storage, databases, reverse proxy routing, and sometimes authentication services.
Observability becomes more useful when those dependencies are understood rather than treating every alert as an independent event.
This is especially important as the environment moves toward high availability and greater automation, because automated recovery is only valuable when the dependencies required by a recovered service are also healthy.
Troubleshooting Model+
The preferred troubleshooting model starts with symptoms and then moves through evidence rather than immediately changing configuration.
Availability checks identify what users can reach, metrics identify resource and performance conditions, logs provide event detail, and architecture knowledge identifies the dependencies that should be inspected next.
This approach reduces the temptation to solve problems by disabling security controls or making unverified configuration changes.
Observability & AI+
The observability layer will become an important data source for the planned AI Network Agent.
The initial AI design is read-oriented: the agent should be able to understand documentation and eventually consume selected monitoring and observability information to summarize health, identify anomalies, and assist with troubleshooting.
Operational actions will remain behind controlled automation and approval mechanisms rather than giving an AI model unrestricted access to infrastructure.
Observability Design Philosophy+
The objective is to make the environment explainable.
When something fails, the long-term goal is to have enough telemetry to determine what changed, which dependency was affected, when the problem began, and how the failure propagated.
That makes observability a troubleshooting and reliability capability rather than simply another collection of tools.