Home Lab
Monitoring
Operational monitoring focused on availability, health, resource utilization, performance, and alerting across compute, network, storage, and application services.
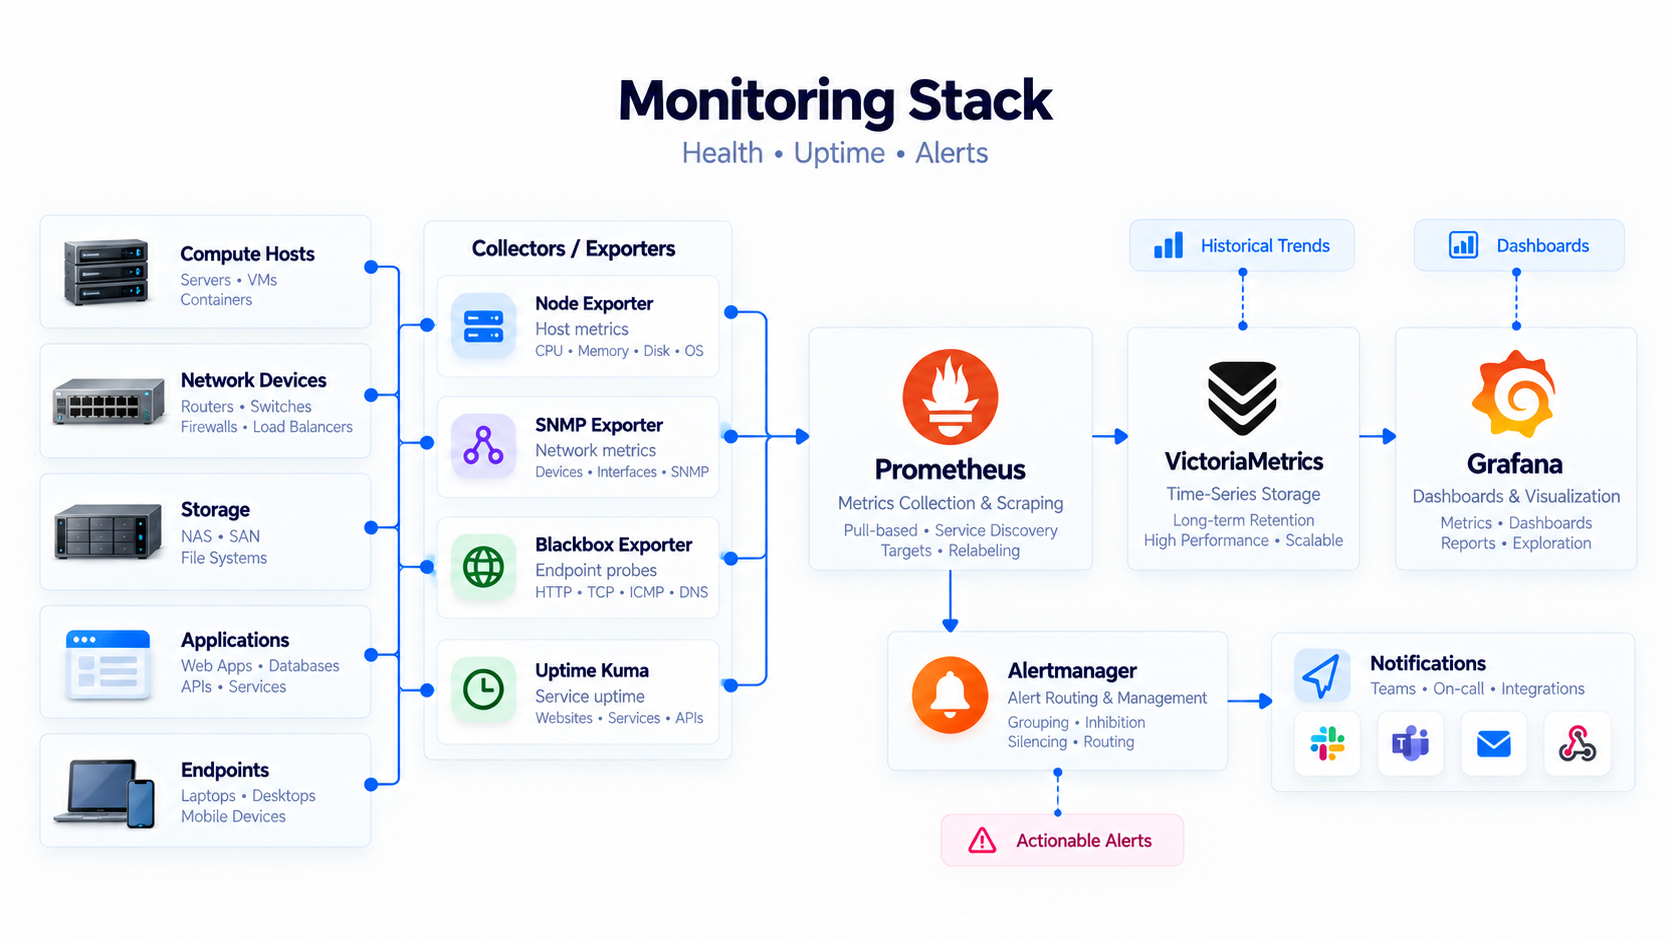
Monitoring Strategy+
Monitoring is intended to answer a straightforward operational question: is the environment healthy right now, and is anything moving toward failure?
The monitoring layer covers compute nodes, Linux hosts, network devices, storage, application endpoints, and supporting services.
The goal is to detect problems before they become user-visible outages and to provide enough context to identify whether the problem is at the application, operating-system, network, storage, or physical-resource layer.
Monitoring is treated separately from observability. Monitoring focuses primarily on known health indicators and conditions, while observability provides the deeper telemetry required to investigate why a system is behaving the way it is.
Prometheus+
Prometheus provides the primary metrics-collection model for the monitoring environment.
It collects time-series measurements from exporters and compatible applications so infrastructure behavior can be evaluated over time rather than through one-time manual checks.
Metrics such as CPU usage, memory utilization, filesystem consumption, network behavior, service availability, and other infrastructure signals can be queried and used to drive dashboards and alerts.
VictoriaMetrics+
VictoriaMetrics provides a time-series metrics storage and query backend for operational data.
It complements the metrics-collection architecture by providing an efficient location for retaining and querying time-series information.
Longer-term metric retention allows current conditions to be compared with historical behavior, which is valuable for capacity planning, trend analysis, and troubleshooting intermittent problems.
Grafana+
Grafana provides the visualization layer for infrastructure and application metrics.
Dashboards can combine data from different parts of the environment and present them in a way that makes changes, trends, saturation, and abnormal behavior easier to recognize.
Rather than checking every system independently, Grafana provides a consolidated operational view across compute, storage, networking, and applications.
Uptime Kuma+
Uptime Kuma provides straightforward service and endpoint availability monitoring.
It is useful for answering whether a service is reachable, whether an endpoint is responding, and whether availability has changed over time.
This provides a simple service-level view that complements the lower-level resource metrics collected elsewhere in the monitoring stack.
Node Exporter+
Node Exporter exposes operating-system and hardware-related metrics from Linux systems.
This includes measurements such as CPU utilization, memory use, filesystem capacity, load, and other host-level indicators.
These metrics are important because an application can appear unhealthy when the underlying problem is actually resource exhaustion on the host running it.
SNMP Exporter+
SNMP Exporter provides a way to collect metrics from infrastructure devices that expose operational information through SNMP.
This extends the monitoring model beyond Linux servers and applications into network and infrastructure hardware.
Bringing these metrics into the same monitoring environment makes it easier to correlate application behavior with underlying network or device conditions.
Blackbox Exporter+
Blackbox Exporter performs endpoint-style probes that test services from the outside rather than relying entirely on internal application metrics.
This helps answer whether a service can actually be reached and whether the expected protocol or endpoint is responding.
That distinction matters because an application process may be running while DNS, routing, TLS, firewall policy, or the reverse proxy prevents users from successfully reaching it.
Alertmanager+
Alertmanager provides the alert-handling layer for conditions detected by the monitoring environment.
The purpose of alerting is not to generate a notification for every change. It is to identify conditions that are actionable or that indicate meaningful degradation.
Examples include service outages, abnormal resource consumption, storage thresholds, endpoint failures, or infrastructure conditions that could become outages if left unresolved.
As the environment matures, alert quality is as important as alert quantity. Excessive low-value alerts create noise and make meaningful problems easier to miss.
Storage Monitoring+
Storage monitoring is particularly important because capacity problems can develop gradually and then appear suddenly at the application layer.
The Plex filesystem reaching 100 percent utilization demonstrated why a service can technically still be running while the infrastructure beneath it has already reached a critical condition.
Storage monitoring therefore includes capacity, growth, filesystem utilization, and availability rather than relying only on whether an application is responding.
The UNAS Pro and its approximately 40 TB of usable RAID 5 capacity also make storage trend analysis and capacity forecasting increasingly important.
Network Monitoring+
Network monitoring focuses on the availability and health of the infrastructure connecting users, applications, compute, and storage.
The environment includes redundant UniFi gateways, managed switching, multiple VLANs, WireGuard remote access, DNS services, and a 10GbE SFP+ backbone.
Monitoring these dependencies helps distinguish an application outage from a routing, DNS, gateway, switching, or connectivity problem.
Application Monitoring+
Application monitoring combines endpoint availability with supporting infrastructure metrics.
A successful health check confirms that an application is reachable, but deeper host and dependency metrics are still needed to determine whether the service is operating normally.
This layered model prevents application health from being reduced to a single up-or-down result.
Monitoring Design Philosophy+
The monitoring design is intended to provide early warning, operational awareness, and actionable information rather than simply produce dashboards.
The most useful monitoring connects service health to the resources and dependencies supporting that service.
Over time, the goal is to move from reactive troubleshooting toward proactive detection of capacity, reliability, and performance issues.